Friends,
I was black pilled by the "Your Groups are Two Small Hornaday" podcast series. I have a long set of notes on their points and how they relate to at least my reloading journey (I'm a beginner). For this post, it suffices to say that I'm looking at inferential statistical methods to tell two different reloading treatments apart from each other with the minimum required shots. Essentially proposing the statistical question in the language of stats Ho = Reloading method A results in the same dispersion as Reloading Method B. Ha = Reloading Method A results in a different dispersion from Reloading Method B. P value is, say, 0.05.
Unfortunately, after their black pill podcasts the team didn't leave us in a better place than "just shoot dozens of shots for each load, and only try a few different loads" (a few powder and bullet combinations). Statistics is a powerful tool for measuring and quantifying the difference between two different treatments, such as two different seating depths etc. maximizing what we can confidently say from the data available.
I'm interested in a separate conversation about what figure of merit is the best to use to measure differences in reloading treatments, whether it's radius, x and/or y variance, Circular Error Probable, Weapons Employment Zone, or what if anyone wants to start that conversation (or point me to one here). But for the moment I was looking at the variance of the radius assuming dispersion is randomly distributed in direction as well as that the x and y dispersions are equally distributed (no positive compensation causing different vertical dispersion etc.).
So, that brings me to my point. I found that I can get access to the x and y points in OnTarget TDS (https://ontargetshooting.com/ontarget-tds/) and in Taran (https://taran.ptosis.ch/taran.html) to run the statistics.
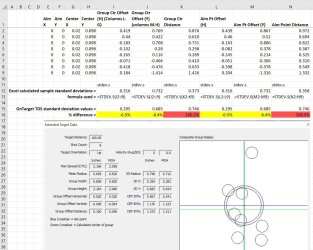
I also found that both programs do some calculations of the standard deviation of the dispersion. However, their numbers are way off from what I calculate with the x/y coordinates that they export.
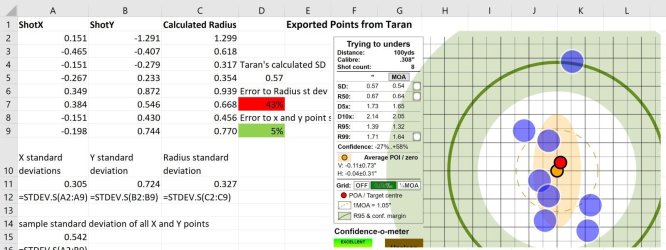
In Ontarget TDS the value they propose for the radius standard deviation is 100% bigger than the number I calculate. When I calculate the horizontal and vertical standard deviations just to check we are off by only ~5%. If I use population standard deviation instead of sample standard deviation we actually match there, so I propose they are using the wrong metric for statistical inferences on their x and y standard deviation. 100% off on radius is crazy and not explained by using a different view of how to calculate standard deviation. Anyone care to weigh in on if I'm doing something wrong or if they've had similar experiences? I show all my work in the attached image. I emailed them ~ a week ago and haven't received a response as of publishing this post.
In Zaran, they don't specify what they are calculating the standard deviation on. When I compare their number to the x, or the y, or the radius that I calculate we are way off. However, if I do a sample standard deviation with all the x and y values then the number is 5% off. So, again rounding error shouldn't be off by 5%, but I assume that is the sample set definition Zaran is using. Any ideas on the potential source of 5% error? Any thoughts on if/why calculating standard deviation on the population of all the x and y points would be more valuable for statistical inference that the on the radius?
I was black pilled by the "Your Groups are Two Small Hornaday" podcast series. I have a long set of notes on their points and how they relate to at least my reloading journey (I'm a beginner). For this post, it suffices to say that I'm looking at inferential statistical methods to tell two different reloading treatments apart from each other with the minimum required shots. Essentially proposing the statistical question in the language of stats Ho = Reloading method A results in the same dispersion as Reloading Method B. Ha = Reloading Method A results in a different dispersion from Reloading Method B. P value is, say, 0.05.
Unfortunately, after their black pill podcasts the team didn't leave us in a better place than "just shoot dozens of shots for each load, and only try a few different loads" (a few powder and bullet combinations). Statistics is a powerful tool for measuring and quantifying the difference between two different treatments, such as two different seating depths etc. maximizing what we can confidently say from the data available.
I'm interested in a separate conversation about what figure of merit is the best to use to measure differences in reloading treatments, whether it's radius, x and/or y variance, Circular Error Probable, Weapons Employment Zone, or what if anyone wants to start that conversation (or point me to one here). But for the moment I was looking at the variance of the radius assuming dispersion is randomly distributed in direction as well as that the x and y dispersions are equally distributed (no positive compensation causing different vertical dispersion etc.).
So, that brings me to my point. I found that I can get access to the x and y points in OnTarget TDS (https://ontargetshooting.com/ontarget-tds/) and in Taran (https://taran.ptosis.ch/taran.html) to run the statistics.
I also found that both programs do some calculations of the standard deviation of the dispersion. However, their numbers are way off from what I calculate with the x/y coordinates that they export.
In Ontarget TDS the value they propose for the radius standard deviation is 100% bigger than the number I calculate. When I calculate the horizontal and vertical standard deviations just to check we are off by only ~5%. If I use population standard deviation instead of sample standard deviation we actually match there, so I propose they are using the wrong metric for statistical inferences on their x and y standard deviation. 100% off on radius is crazy and not explained by using a different view of how to calculate standard deviation. Anyone care to weigh in on if I'm doing something wrong or if they've had similar experiences? I show all my work in the attached image. I emailed them ~ a week ago and haven't received a response as of publishing this post.
In Zaran, they don't specify what they are calculating the standard deviation on. When I compare their number to the x, or the y, or the radius that I calculate we are way off. However, if I do a sample standard deviation with all the x and y values then the number is 5% off. So, again rounding error shouldn't be off by 5%, but I assume that is the sample set definition Zaran is using. Any ideas on the potential source of 5% error? Any thoughts on if/why calculating standard deviation on the population of all the x and y points would be more valuable for statistical inference that the on the radius?