Eagle Ballistics breaks down the flight details of your bullet based on the range shot.


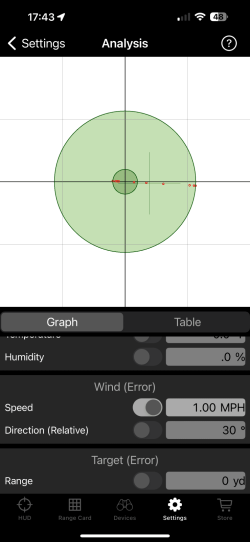
Eagle Ballistics showing Accuracy Analysis Tool
This tool is used to understand how inaccuracy in the parameters you have entered for your rifle, scope, bullet, or target affect the point of impact.
Circular Error Probable
One of the important analysis is the Circular Error Probable (CEP). This determine the minimum size circle of error which contains a certain fraction of impacts. This tool provides an inner CEP of 50% and an outer circle of 95%. The circles correspond to the area that will be impacted with 50% and 95% of the time, respectively.
The CEP values selected by this tool do not match those used in the CEP link. While CEP can be associated with normal distributions and standard deviations, the CEP displayed by this tool are calculated by sorting the results of the Monte Carlo simulation, not by multiplying the standard deviation.
Results
The results of the simulation can be shown either in Graphical or Table display.
Graphical
In Graphical display, the simulated points of impact are shown on a target display. Each simulated shot is shown as a small red circle. The target is automatically scaled according to how much dispersion the bullets have. The center of the target (marked by black cross hairs) shows desired point of impact.
A grid is with 1 MOA or 0.1 mrad spacing is shown.
Green shaded rings are shown for 50% and 95% CEP. A final circle is shown for the maximum error distance. When using a Normal Distribution this final ring can be fairly large due to a high-error shot with low probability.
An option circular or square plate may be shown, if the option is enabled.
A small secondary green cross-hair is shown for the average impact point which is normally near the target center, but may vary depending on the type of error introduced.
Table
The Table display shows a numerical analysis of the dispersion. An Average and Maximum Error is shown. For each axis, the Minimum, Maximum, Average, and Standard Deviation are shown.
Values are shown both in absolute distance as well as MOA or mrad units.
Circular Error Probable values are shown for the 50% and 95% of samples.
If enabled, hit probability for a circular or square plate is shown